Conditions in commercial real estate markets improved across the board in the fourth quarter of 2021. Robust demand from tenants contributed to declining vacancy rates across most property types, and faster rent growth. Among the four major property types with detailed data from CoStar on demand, supply, vacancies, and rents, two that had been among the most impacted by the pandemic—office and retail—showed signs of stabilization and continuing rebound, respectively. Two markets that have faced roaring demand during the pandemic—industrial and multifamily—are experiencing record rent growth with very few vacancies.
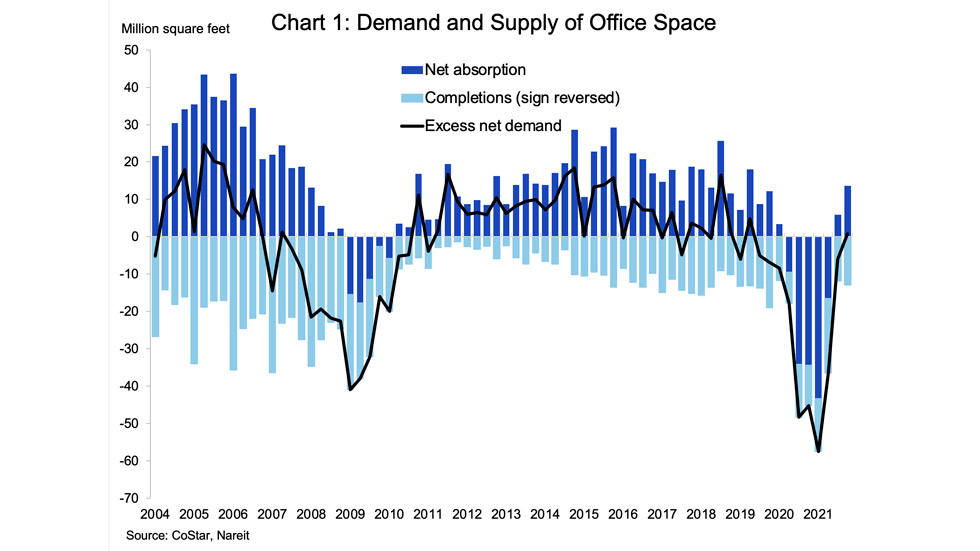
Office markets had 13.6 million square feet of net absorption (i.e. growth in demand) in the fourth quarter, more than twice the amount in the third quarter. Demand exceeded supply, slightly, for the first time since 2018. Among major metros, there was positive net absorption in Boston, Los Angeles, San Francisco, and Washington, DC. Net absorption was negative, however, in Chicago and New York. Net absorption was positive in 16 of the next 20 largest cities, including Dallas-Fort Worth, Houston, Philadelphia, Atlanta, Seattle, and San Diego.
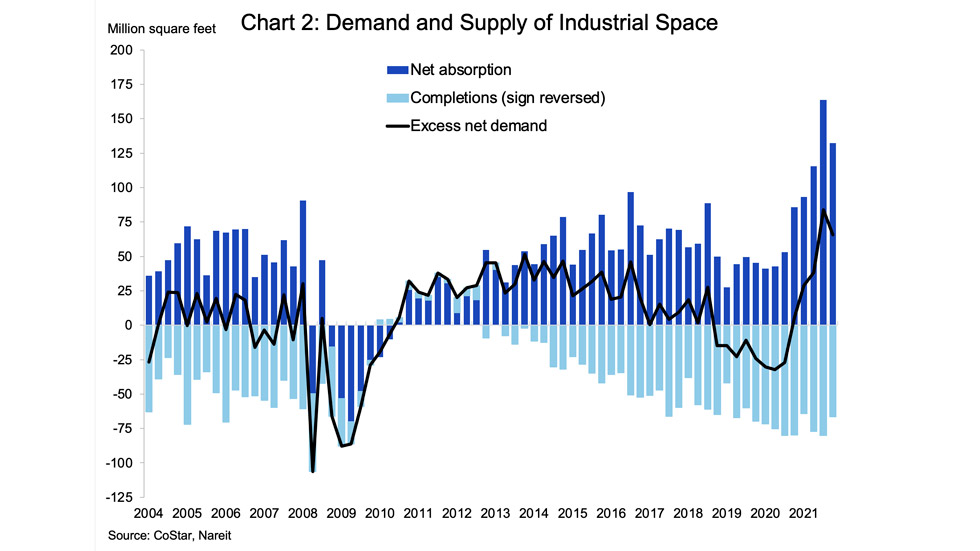
Industrial markets had net absorption of 132.5 million square feet, the second highest on record after the 163.8 million in the third quarter. A lack of available space may have kept demand from growing faster as vacancy rates dropped 40 bps to a record low of 4.2%.
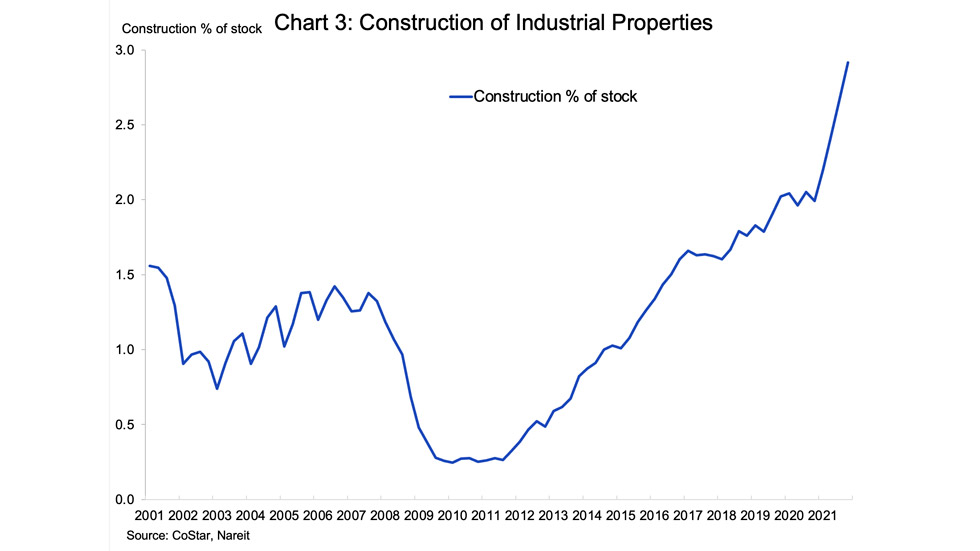
Industrial/logistics facilities are a key part of the supply chain, helping goods bought online get to the last mile delivery to consumers. Construction has surged during the pandemic, with over 500 million square feet of new facilities under construction. This is equal to 2.9% of the existing stock; for comparison, construction activity was less than 1% of existing stock at a comparable point in the recovery from the 2008-2009 financial crisis.
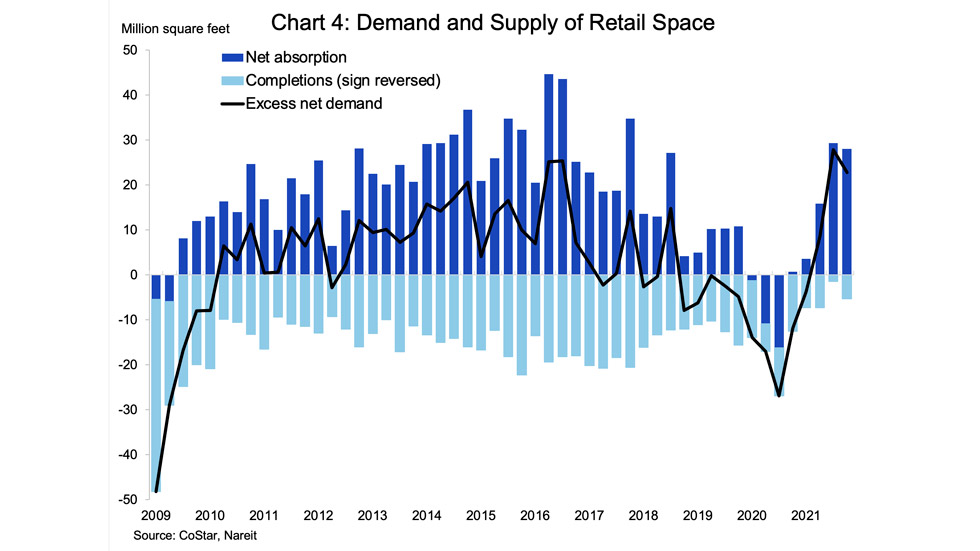
Retail properties saw the second consecutive quarter of robust demand, with net absorption of 28 million square feet. The third and fourth quarters of 2021 had the highest half-year growth in demand since 2016. There is very little new construction of retail properties.
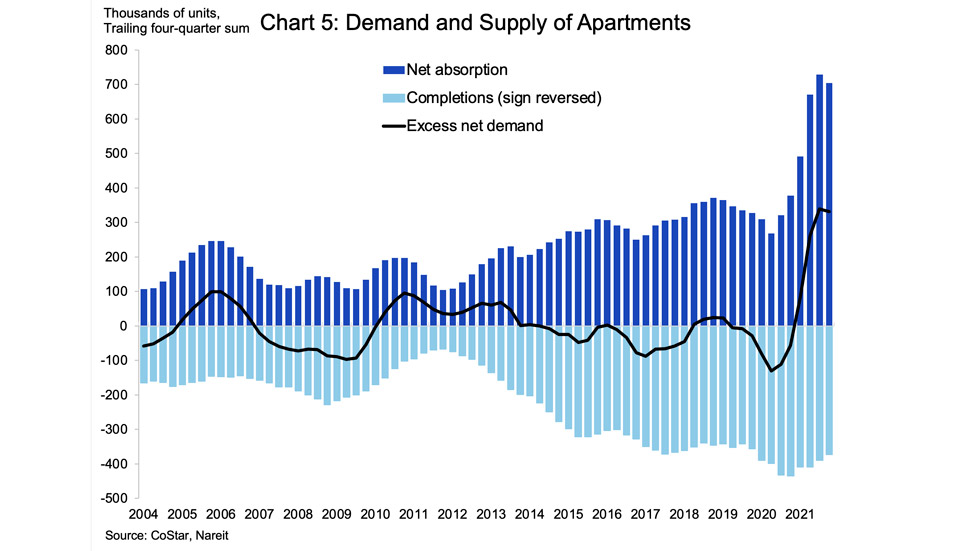
Multifamily demand eased in the fourth quarter, to 71,600 units, from 185,300 in the third quarter. Some of this slowdown reflects normal seasonal patterns, as the fourth quarter typically is the slowest period each year for apartment leasing. In addition, vacant apartments are hard to find, and rising rents are creating affordability challenges for many households. Net absorption over the past four quarters, which averages out these seasonal differences, edged down very slightly from the prior quarter, but continued to exceed new supply by a ratio of nearly 2:1.
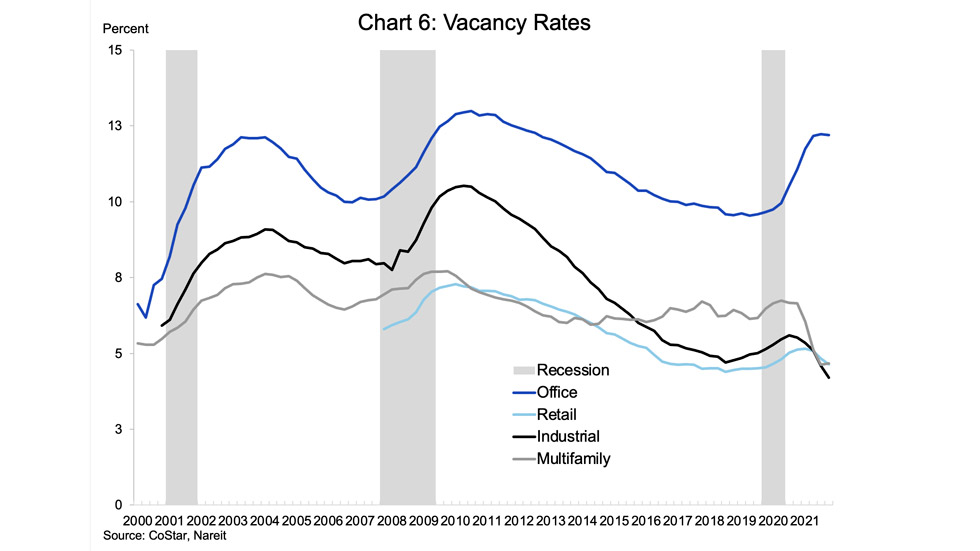
Vacancy rates fell sharply in industrial and retail markets, declining 40 bps and 20 bps, respectively. Office vacancy rates, in contrast, have stabilized, as they have been essentially unchanged for the past three quarters following an increase of 250 bps over the prior one and a half years. Apartment vacancy rates ticked slightly higher, moving up 5 bps from the record low in the third quarter.
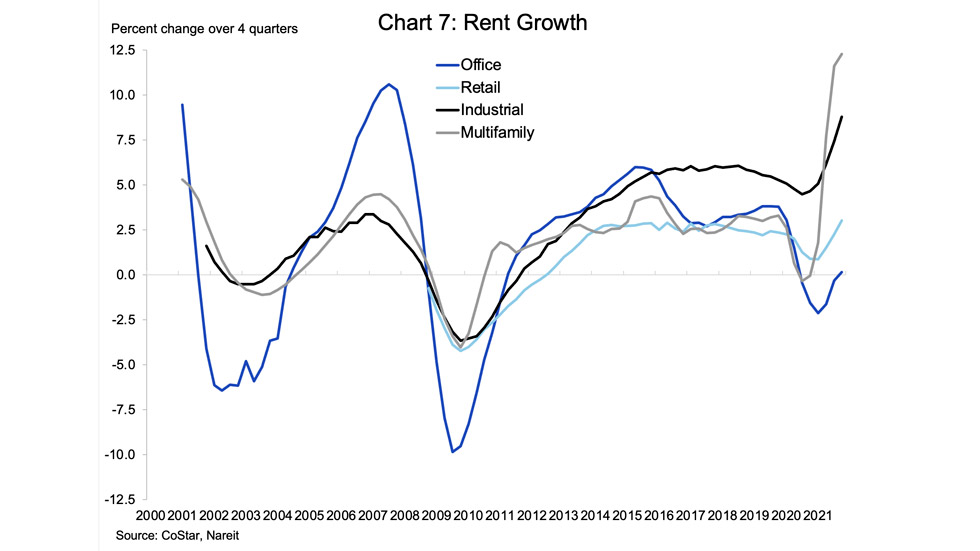
Rent growth accelerated for most property types. Apartment rents rose 12.3% compared to the fourth quarter of 2020, while industrial rents were up 8.8%. Retail rents are steadily improving, increasing 3.0% over the past year. Office rents edged slightly higher compared to a year earlier, the first year-over-year increase since early 2020.