 With a total of $8.4 trillion in assets under management, public and corporate sector pension funds represent a major portion of the $24.7 trillion of assets on which millions of Americans rely for their retirement security. With funding liabilities on the rise, pension funds are under increased pressure to maximize returns and generate steady income.
CEM Benchmarking, an independent provider of benchmarking information for institutional investors, has unveiled a new study, sponsored by NAREIT, that examines fund performance and capital allocations for more than 200 public and private pension funds over the 17-year period from 1998 to 2014.
REIT magazine spoke with CEM’s Alex Beath about the study and what it says about REIT allocations in most pension funds.
REIT: What are the REIT-related highlights of the recent CEM study on asset allocations in pension funds?
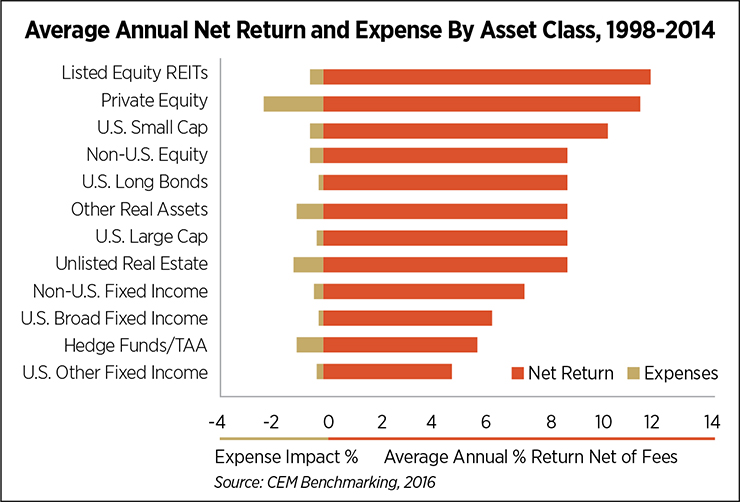
ALEX BEATH: The study compares gross and net average total returns as well as net compound returns across 12 asset classes. Listed Equity REITs had the highest net total returns over the period, averaging nearly 12 percent.
REIT: How about other notable asset classes?
BEATH: I think the results for the other “alternative” asset classes are interesting. Private equity had the highest gross returns, estimated at 13.5 percent, but had net returns of 11.4 percent because of the impact of expenses. Unlisted real estate also performed well: It produced average net returns of 8.6 percent over the period.
Hedge fund performance stands out for its weak performance. Hedge funds (the aggregate asset class also includes internally managed tactical asset allocation assets) were the second worst performing asset class, just ahead of U.S. other fixed income. But that includes cash. So if you exclude cash, hedge funds were the worst performing asset class, even though allocations grew 500 percent.
REIT: The CEM database is quite unique. Can you describe the data and some of the ways you exploit the unique features of the data for this study.
BEATH: CEM has a proprietary dataset covering over 1,000 pensions, endowments and sovereign wealth funds around the world. The dataset includes detailed asset class level holdings, policy weights, benchmark returns, and, most importantly, actual returns and associated investment costs going back as far as 1990.
For this study, we focused on U.S. pension funds covering 17 years. This is simply because prior to 1998, REITs were just rolled in with other asset classes.
Typically, the set contains around 200 public and corporate sector pensions per year, representing about 45 percent of the U.S. defined benefit (DB) market (approximately $3 trillion in 2014). One of the unique benefits of the dataset is that it provides the actual realized performance net of investment costs of the assets chosen by plan managers and trustees.
Because we have access to fund level returns for the 17-year period, we are able to provide unique insights into reporting lags associated with illiquid assets classes, non-listed real estate and private equity, in particular. By comparing illiquid fund returns with listed counterparts over multiple years we are able to infer fundlevel reporting lags for these illiquid assets. We remove these lags in order to make better comparisons of returns between liquid and illiquid asset classes and to provide a realistic view of volatilities and correlations, which for illiquids are usually underestimated.

REIT: What are the implications of the more realistic view of volatilities and correlations?
BEATH: One of the most striking results is the volatility of private equity. After adjusting for reporting lags and computing volatilities within periods as well as across periods (to account for the variation in returns across funds), private equity has, by far, the highest measured volatility at 28 percent. In fact, while private equity was the second best performing asset class in terms of net annual return, as a result of the high volatility, it is the fourth worst performing asset class in terms of risk-adjusted returns.
Another striking result was that after adjusting for valuation lags, we found that REITs and unlisted real estate had comparable volatilities. REITs and unlisted real estate had the fourth and fifth most volatile net returns, with measured volatilities of 21 percent and 20 percent respectively. The similarity in volatilities was surprising because the two asset classes have different amounts of leverage. So while leverage boosts REIT volatility as expected—a risk factor which paid off handsomely by the way—unlisted real estate volatility got a similar and unexpected boost from idiosyncratic risk, a risk factor which didn’t pay off.
I think this is a really important finding. Traditionally, investors in unlisted real estate see the benchmark returns and think unlisted real estate is much less volatile than it really is. But that smoothed return is not real; it’s just caused by the different lags from one fund to the next. What any one fund actually gets is better represented by the unsmoothed return.
REIT: What are some of the key takeaways for investors with respect to fees and performance?
BEATH: One of the most interesting and unique results that investors should note is the expense associated with fund-of-funds as an entry point for unlisted real estate, hedge funds and private equity. This result may come as a surprise to some because fund-of-funds are often sold to investors as inexpensive access points into otherwise difficult to access asset classes. However, as the paper points out, the cost comparison between external LPs and fund-of-funds typically omits the underlying base fees and performance fees paid by the fund-of-fund manager to external LPs.
To learn more about the CEM study, read the full report or watch a video discussing the results, visit REIT.com/CEMstudy.
Alex Beath is a Senior Research Analyst at CEM Benchmarking. Beath is responsible for modeling and programming support to the business teams. Prior to joining CEM, he was engaged in post-doctoral research at the Center for Biological Physics at University of California at San Diego.